


A fairly lengthy but interesting read, obviously not a perfect study (nothing possibly can be) and it only focuses on deaths and not than cases and hospital admissions, but it does use a large sample size of similar countries and regions rather than the usual practice of cherry-picking certain countries to suit an agenda (comparing the UK to New Zealand for example lol).
In conclusion, using this methodology and current data, in 98% of the comparisons using 87 different regions of the world we found no evidence that the number of deaths/million is reduced by staying at home.
Stay at-home policy is a case of exception fallacy: an internet-based ecological study
R F Savaris 1 2 3, G Pumi 4, J Dalzochio 5, R Kunst 5
Scientfic Reports volume 11, Article number: 5313 (2021)
Abstract
A recent mathemaical model has suggested that staying at home did not play a dominant role in reducing COVID-19 transmission. The second wave of cases in Europe, in regions that were considered as COVID-19 controlled, may raise some concerns. Our objective was to assess the association between staying at home (%) and the reduction/increase in the number of deaths due to COVID-19 in several regions in the world.
In this ecological study, data from www.google.com/covid19/mobility/, ourworldindata.org and covid.saude.gov.br were combined. Countries with > 100 deaths and with a Healthcare Access and Quality Index of ≥ 67 were included. Data were preprocessed and analyzed using the difference between number of deaths/million between 2 regions and the difference between the percentage of staying at home. The analysis was performed using linear regression with special attention to residual analysis. After preprocessing the data, 87 regions around the world were included, yielding 3741 pairwise comparisons for linear regression analysis. Only 63 (1.6%) comparisons were significant. With our results, we were not able to explain if COVID-19 mortality is reduced by staying at home in ~ 98% of the comparisons after epidemiological weeks 9 to 34.
A fairly lengthy but interesting read, obviously not a perfect study (nothing possibly can be) and it only focuses on deaths and not than cases and hospital admissions, but it does use a large sample size of similar countries and regions rather than the usual practice of cherry-picking certain countries to suit an agenda (comparing the UK to New Zealand for example lol).
In conclusion, using this methodology and current data, in ~ 98% of the comparisons using 87 different regions of the world we found no evidence that the number of deaths/million is reduced by staying at home.
Introduction
By late January, 2021, approximately 2.1 million people worldwide had died from the new coronavirus (COVID-19)1. Wearing masks, taking personal precautions, testing for COVID-19 and social distancing have been advocated for controlling the pandemic2,3,4. To achieve source control and stop transmission, social distancing has been interpreted by many as staying at home. Such policies across multiple jurisdictions were suggested by some experts5. These measures were supported by the World Health Organization6,7, local authorities8,9,10, and encouraged on social media platforms11,12,13.
Some mathematical models and meta-analyses have shown a marked reduction in COVID-19 cases14,15,16,17,18,19 and deaths20,21 associated with lockdown policies. Brazilian researchers have published mathematical models of spreading patterns22 and suggested implementing social distancing measures and protection policies to control virus transmission23. By May 5th, 2020, an early report, using the number of curfew days in 49 countries, found evidence that lockdown could be used to suppress the spread of COVID-1924. Measures to address the COVID-19 pandemic with Non-Pharmacological Interventions (NPIs) were adopted after Brazil enacted Law No. 1397925, and this was followed by many states such as Rio de Janeiro26, the Federal District of Brasília (Decree No. 40520, dated March 14th, 2020)27, the city of São Paulo (Decree No. 59.283, dated March 16th, 2020)28, and the State of Rio Grande do Sul (Decree No. 55240/2020, dated May 10th, 2020)29. It was expected that, with these actions, the number of deaths by COVID-19 would be reduced. Of note, the country’s most populous state, São Paulo, adopted rigorous quarantine measures and put them into effect on March 24th, 202028. Internationally, Peru adopted the world’s strictest lockdown30.
Recently, Google LLC published datasets indicating changes in mobility (compared to an average baseline before the COVID-19 pandemic). These reports were created with aggregated, anonymized sets of daily and dynamic data at country and sub-regional levels drawn from users who had enabled the Location History setting on their cell phones. These data reflect real-world changes in social behavior and provide information on mobility trends for places like grocery stores, pharmacies, parks, public transit stations, retail and recreation locations, residences, and workplaces, when compared to the baseline period prior to the pandemic31. Mobility in places of residence provides information about the “time spent in residences”, which we will hereafter call “staying at home” and use as a surrogate for measuring adherence to stay-at-home policies.
Studies using Google COVID-19 Community Mobility Reports and the daily number of new COVID-19 cases have shown that over 7 weeks a strong correlation between staying at home and the reduction of COVID-19 cases in 20 counties in the United States32; COVID-19 cases decreased by 49% after 2 weeks of staying at home33; the incidence of new cases/100,000 people was also reduced34; social distancing policies were associated with reduction in COVID-19 spread in the US35; as well as in 49 countries around the world24. A recent report using Brazilian and European data has shown a correlation between NPI stringency and the spread of COVID-1936,37; these analyses are debatable, however, due to their short time span and the type of time series behavior38, or for their use of Pearson’s correlation in the context of non-stationary time series35. The same statistical tools cannot be applied to stationary and non-stationary time series alike39, and the latter is the case with this COVID-19 data.
A 2020 Cochrane systematic review of this topic reported that they were not completely certain about this evidence for several reasons. The COVID-19 studies based their models on limited data and made different assumptions about the virus17; the stay-at-home variable was analyzed as a binary indicator40; and the number of new cases could have been substantially undocumented41; all which may have biased the results. A sophisticated mathematical model based on a high-dimensional system of partial differential equations to represent disease spread has been proposed42. According to this model, staying at home did not play a dominant role in disease transmission, but the combination of these, together with the use of face masks, hand washing, early-case detection (PCR test), and the use of hand sanitizers for at least 50 days could have reduced the number of new cases. Finally, after 2 months, the simulations that drove the world to lockdown have been questioned43.
These studies applied relatively complex epidemiological models with unrealistic assumptions or parameters that were either user-chosen or not deemed to work properly. Furthermore, the effects in the death rates were directly inferred from the aftermath of a given intervention without a control group. Finally, the temporal delay between the introduction of a certain intervention and the actual measurable variation in death rates was not properly taken into account44,45.
The rationale we are looking for is the association between two variables: deaths/million and the percentage of people who remained in their residences. Comparison, however, is difficult due to the non-stationary nature of the data. To overcome these problems, we proposed a novel approach to assess the association between staying at home values and the reduction/increase in the number of deaths due to COVID-19 in several regions around the world. If the variation in the difference between the number of deaths/million in two countries, say A and B, and the variation in the difference of the staying at home values between A and B present similar patterns, this is due to an association between the two variables. In contrast, if these patterns are very different, this is evidence that staying at home values and the number of deaths/million are not related (unless, of course, other unaccounted for factors are at play). In view of this, the proposed approach avoids altogether the problems enumerated above, allowing a new approach to the problem.
After more than 25 epidemiological weeks of this pandemic, verifying if staying at home had an impact on mortality rates is of particular interest. A PUBMED search with the terms “COVID-19” AND (Mobility) (search made on September 8th, 2020) yielded 246 articles; of these, 35 were relevant to mobility measures and COVID-19, but none compared mobility reduction to mortality rates.
Results
A flowchart of the data manipulation is depicted in Fig. 1. Briefly, Google COVID-19 Community Mobility Report data between February 16th and August 21st, 2020, yielded 138 separate countries and their regions. The website Our World in Data provided data on 212 countries (between December 31st, 2019, and August 26th, 2020), and the Brazilian Health Ministry website provided data on all states (n = 27) and cities (n = 5,570) in Brazil (February 25th to August 26th, 2020).
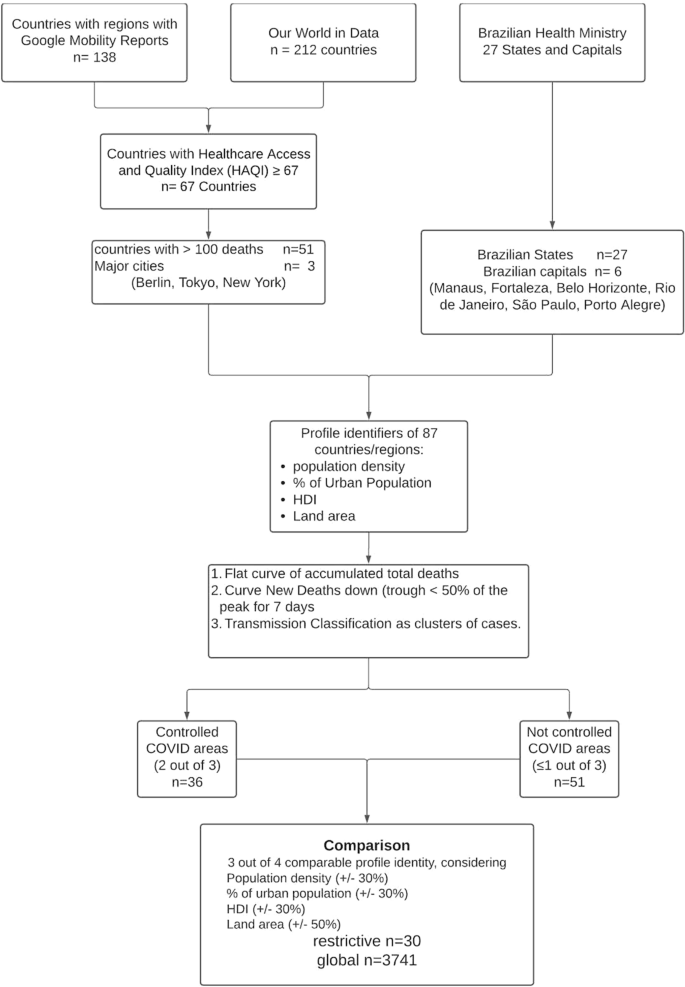
Flow chart of the data setup (further details are in Auxiliary Supplementary Material—Flow chart).
After data compilation, a total of 87 regions and countries were selected: 51 countries, 27 States in Brazil, six major Brazilian State capitals [Manaus, Amazonas (AM), Fortaleza, Ceará (CE), Belo Horizonte, Minas Gerais (MG), Rio de Janeiro, Rio de Janeiro (RJ), São Paulo, São Paulo (SP) and Porto Alegre, Rio Grande do Sul (RS)], and three major cities throughout the world (Tokyo, Berlin and New York) (Fig. 1).
Characteristics of these 87 regions are presented in Table 1 (further details are in Supplemental Material—Characteristics of Regions).
Table 1 Characteristics of the 87 regions and countries used for comparison in the study. HDI = Human Development Index (the higher, the better).
Comparisons
The restrictive analysis between controlled and not controlled areas yielded 33 appropriate comparisons, as shown in Table 2. Only one comparison out of 33 (3%)—state of Roraima (Brazil) versus state of Rondonia (Brazil)—was significant (p-value = 0.04). After correction for residual analysis, it did not pass the autocorrelation test (Lagrange Multiplier test = 0.04). (Further details are in Supplemental Material—Restrictive Analysis).
Table 2 Comparisons using the 4-point criteria. Comparability was considered if at least 3 out of 4 of the following conditions were similar: a) population density, b) percentage of the urban population, c) Human Development Index and d) total area of the region. Similarity was considered adequate when a variation in conditions a), b) and c) was within 30%, while, for condition d), a variation of 50% was considered adequate (Further details are in Auxiliary Supplementary Material—4 point criteria).
The global comparison yielded 3,741 combinations; from these, 184 (4.9%) had a p-value < 0.05, after correcting for False Discovery Rate (Table S1). After performing the residual analysis, by testing for cointegration between response and covariate, normality of the residuals, presence of residual autocorrelation, homoscedasticity, and functional specification, only 63 (1.6%) of models passed all tests (Table S2). Closer inspection of several cases where the model did not pass all the tests revealed a common factor: the presence of outliers, mostly due to differences in the epidemiological week in which deaths started to be reported. A heat map showing the comparison between the 87 regions is presented in Fig. 2.
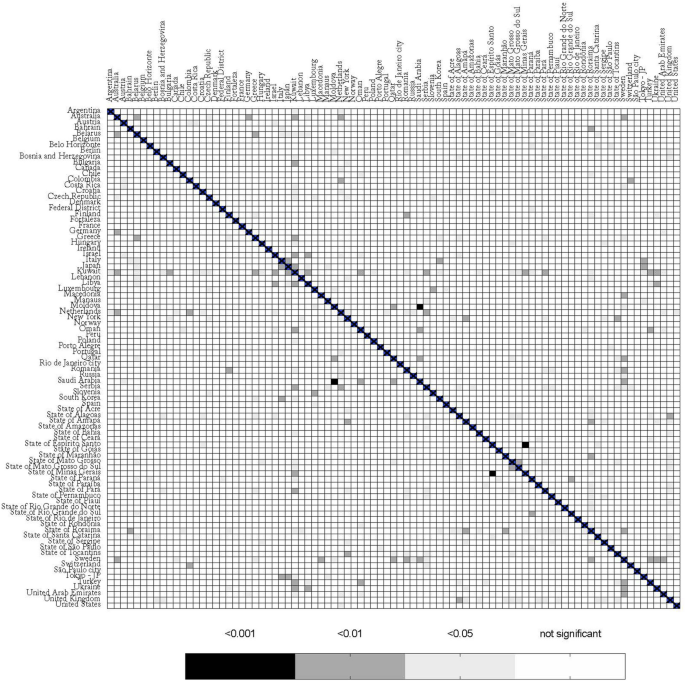
Heat map comparing different regions with COVID-19. The bar below represents p-values for the linear regression.
Discussion
We were not able to explain the variati of deaths/million in different regions in the world by social isolation, herein analyzed as differences in staying at home, compared to baseline. In the restrictive and global comparisons, only 3% and 1.6% of the comparisons were significantly different, respectively. These findings are in accordance with those found by Klein et al.46 These authors explain why lockdown was the least probable cause for Sweden’s high death rate from COVID-1946. Likewise, Chaudry et al. made a country-level exploratory analysis, using a variety of socioeconomic and health-related characteristics, similar to what we have done here, and reported that full lockdowns and wide-spread testing were not associated with COVID-19 mortality per million people47. Different from Chaudry et al., in our dataset, after 25 epidemiological weeks, (counting from the 9th epidemiological week onwards in 2020) we included regions and countries with a “plateau” and a downslope phase in their epidemiological curves. Our findings are in accordance with the dataset of daily confirmed COVID-19 deaths/million in the UK. Pubs, restaurants, and barbershops were open in Ireland on June 29th and masks were not mandatory48; after more than 2 months, no spike was observed; indeed, death rates kept falling49. Peru has been considered to be the most strict lockdown country in the world30, nevertheless, by September 20th, it had the highest number of deaths/million50. Of note, differences were also observed between regions that were considered to be COVID-19 controlled, e.g., Sweden versus Macedonia. Possible explanations for these significant differences may be related to the magnitude of deaths in these countries. After October 2020, when our study was published in a preprint server for Health Sciences, new articles were published with similar results51,52,53,54.
Our results are different from those published by Flaxman et al. The authors applied a very complex calculation that NPIs would prevent 3.1 million deaths across 11 European countries44. The discrepant results can be explained by different approaches to the data. While Flaxman et al. assumed a constant reproduction number (Rt) to calculate the total number of deaths, which eventually did not occur, we calculated the difference between the actual number of deaths between 2 countries/regions. The projections published by Flaxman et al.44 have been disputed by other authors. Kuhbandner and Homburg described the circular logic that this study involved. Flaxman et al. estimated the Rt from daily deaths associated with SARS-CoV-2 using an a priori restriction that Rt may only change on those dates when interventions become effective. However, in the case of a finite population, the effective reproduction number falls automatically and necessarily over time since the number of infections would otherwise diverge55. A recent preprint report from Chin et al.56 explored the two models proposed by the Imperial College44 by expanding the scope to 14 European countries from the 11 countries studied in the original paper. They added a third model that considered banning public events as the only covariate. The authors concluded that the claimed benefits of lockdown appear grossly exaggerated since inferences drawn from effects of NPIs are non-robust and highly sensitive to model specification56.
The same explanation for the discrepancy can be applied to other publications where mathematical models were created to predict outcomes14,15,16,17,18. Most of these studies dealt with COVID-19 cases 33,34 and not observed deaths. Despite its limitations, reported deaths are likely to be more reliable than new case data. Further explanations for different results in the literature, besides methodological aspects, could be justified by the complexity of the virus dynamic, by its interaction with the environment, or they may be related to a seasonal pattern that was, by coincidence, established at the same time when infection rates started to decrease due to seasonal dynamics57. It is unwise to try to explain a complex and multifactorial condition, with the inherent constant changes, using a single variable. An initial approach would employ a linear regression to verify the influence of one factor over an outcome. Herein we were not able to identify this association. Our study was not designed to explain why the stay-at-home measures do not contain the spread of the virus SARS-CoV-2. However, possible explanations that need further analysis may involve genetic factors58, the increment of viral load, and transmission in households and in close quarters where ventilation is reduced.
This study has a few limitations. Different from the established paradigm of randomized clinical trial, this is an ecological study. An ecological study observes findings at the population level and generates hypotheses59. Population-level studies play an essential part in defining the most important public health problems to be tackled59, which is the case here. Another limitation was the use of Google Community Mobility Reports as a surrogate marker for staying at home. This may underestimate the real value: for instance, if a user´s cell phone is switched off while at home, the observation will be absent from the database. Furthermore, the sample does not represent 100% of the population. This tool, nevertheless, has been used by other authors to demonstrate the efficacy in reducing the number of new cases after NPI60,61. Using different methodologies for measuring mobility may introduce bias and would prevent comparisons between different countries. The number of deaths may be another issue. Death figures may be underestimated, however, reported deaths may be more relevant than new case data. The arbitrary criteria used for including countries and regions, the restrictive comparisons, and our definition of an area as COVID-19 controlled are open for criticism. Nonetheless, these arbitrary criteria were created a priori to the selection of the countries. With these criteria, we expected to obtain representative regions of the world, compare similar regions, and obtain accurate data. By using a HAQI of ≥ 67, we assumed that data from these countries would be accurate, reliable, and health conditions were generally good. Nevertheless, the global analysis of the regions (n=3741n=3741 comparisons) overcame any issue of the restrictive comparison. Indeed, the global comparison confirmed the results found in the restrictive one; only 1.6% of the death rates could be explained by staying at home. Also, our effective sample size in all studies is only 25 epidemiological weeks, which is a very small sample size for a time series regression. The small sample size and the non-stationary nature of COVID-19 data are challenges for statistical models, but our analysis, with 25 epidemiological weeks, is relatively larger than previous publications which used only 7 weeks62. A short interval of observation between the introduction of an NPI and the observed effect on death rates yields no sound conclusion, and is a case where the follow-up period is not long enough to capture the outcome, as seen in previous publications44,45. The effects of small samples in this case are related to possible large type II errors and also affect the consistency of the ordinary least square estimates. Nevertheless, given the importance of social isolation promoted by world authorities63, we expected a higher incidence of significant comparisons, even though it could be an ecological fallacy. The low number of significant associations between regions for mortality rate and the percentage of staying at home may be a case of exception fallacy, which is a generalization of individual characteristics applied at the group-level characteristics64.
There are strengths to highlight. Inclusion criteria and the Healthcare Access and Quality Index were incorporated. We obtained representative regions throughout the world, including major cities from 4 different continents. Special attention was given to compiling and analyzing the dataset. We also devised a tailored approach to deal with challenges presented by the data. To our knowledge, our modeling approach is unique in pooling information from multiple countries all at once using up-to-date data. Some criteria, such as population density, percentage of urban population, HDI, and HAQI, were established to compare similar regions. Finally, we gave special attention to the residual analysis in the linear regression, an absolutely essential aspect of studies using small samples.
In conclusion, using this methodology and current data, in ~ 98% of the comparisons using 87 different regions of the world we found no evidence that the number of deaths/million is reduced by staying at home. Regional differences in treatment methods and the natural course of the virus may also be major factors in this pandemic, and further studies are necessary to better understand it. ….
COMPLETE STUDY https://www.nature.com/articles/s41598-021-84092-1#Bib1
IMPORTANTE!: Il materiale presente in questo sito (ove non ci siano avvisi particolari) può essere copiato e redistribuito, purché venga citata la fonte. NoGeoingegneria non si assume alcuna responsabilità per gli articoli e il materiale ripubblicato.Questo blog non rappresenta una testata giornalistica in quanto viene aggiornato senza alcuna periodicità. Non può pertanto considerarsi un prodotto editoriale ai sensi della legge n. 62 del 7.03.2001.